
NeoStat has various nodes for the purpose of visualisation. One of them is the Line chart node.
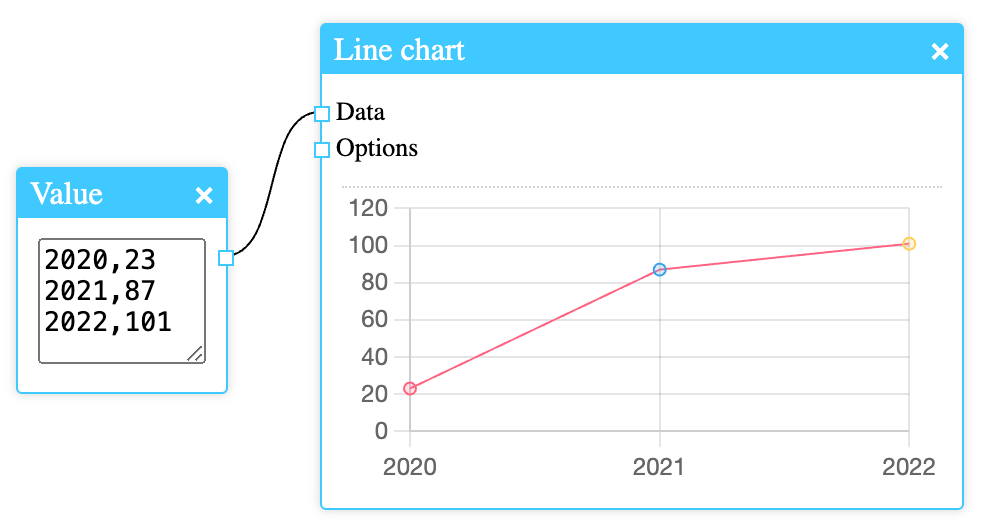
The data input can take different formats depending on the options set. Simple coordinates can be given, one on each line. This is the expected format when no options are given.
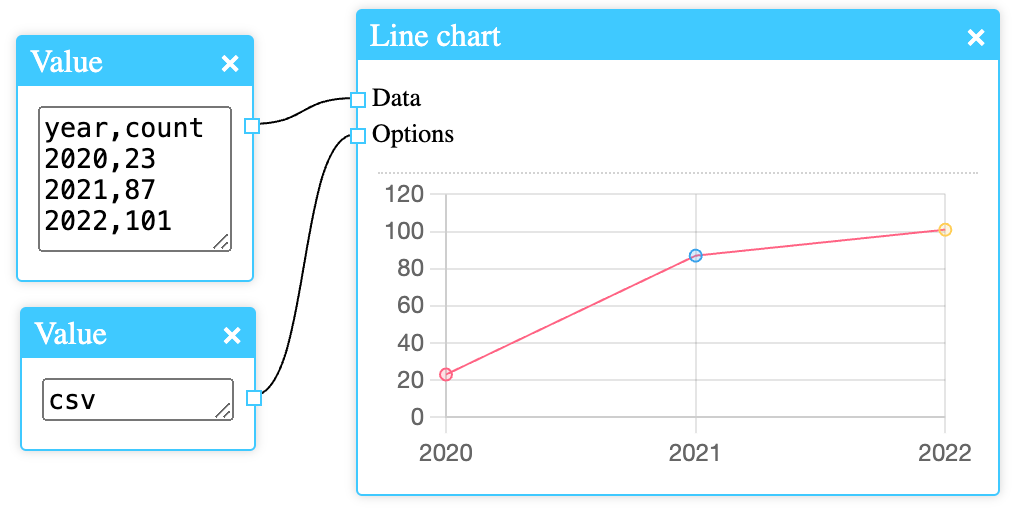
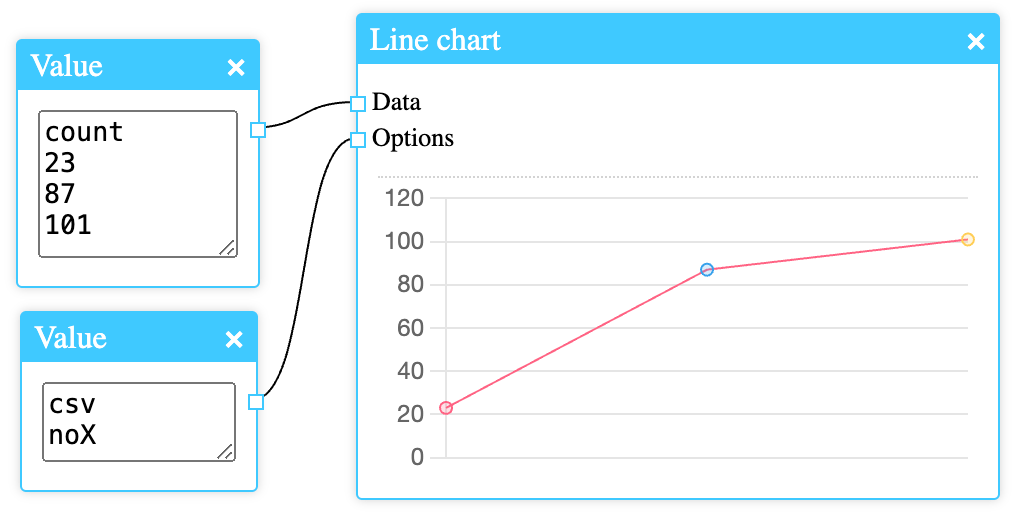
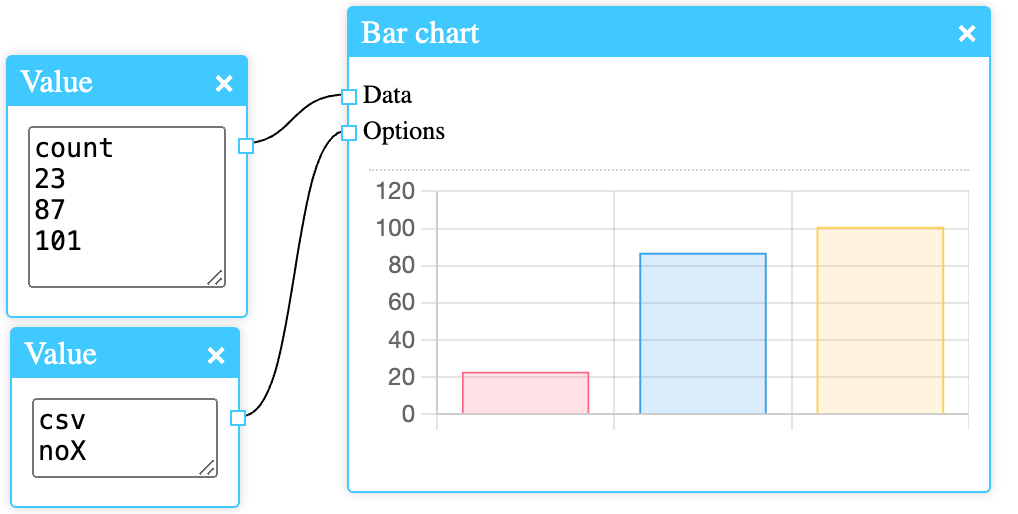
It’s also possible to supply CSV data. Each option is entered on a newline and must be passed to the Options input. If the CSV option is specified then the first line in the data will be ignored.
By using the option noX, one can plot without the x axis.
There is also a Bar chart node with similar functionality and options.

Leave a comment