NeoStat is a software for performing statistical computing. It is a viable option for those looking for a more visual workflow when working with data and visualisations.
Computation is done by arranging and connecting various nodes in a diagram. It is easy to create a dataset, for instance by using the Value node.
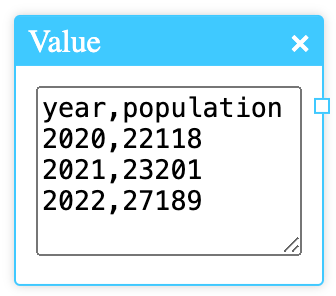
The value node can fill multiple roles; it can be used for generating small datasets and as input for other nodes. When using it as a generator for datasets, use the CSV (Comma-separated-values) format, where variables are separated by commas an observations are separated by newlines.
The node above gives a dataset on its output, consisting of two variables (year and population) and two observations.
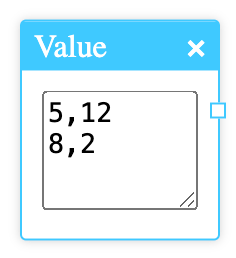
This is an example of using the Value node for data points. Both of these nodes can be used as input for the Line chart node for data plotting.

Leave a comment