Doing simple calculations in R is straight forward.
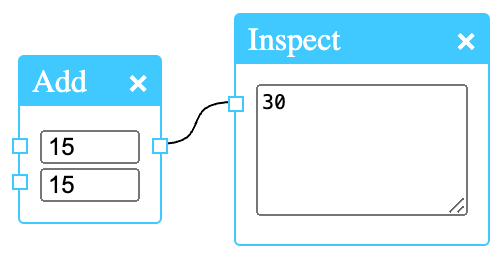
This will print 30:
15 + 15In NeoStat, addition is done with the Add node. In order to see the result, we must connect the output of the Add node to the input of the Inspect node:
This is how we plot a vector in R:
plot(1:4)This will give the following graph:
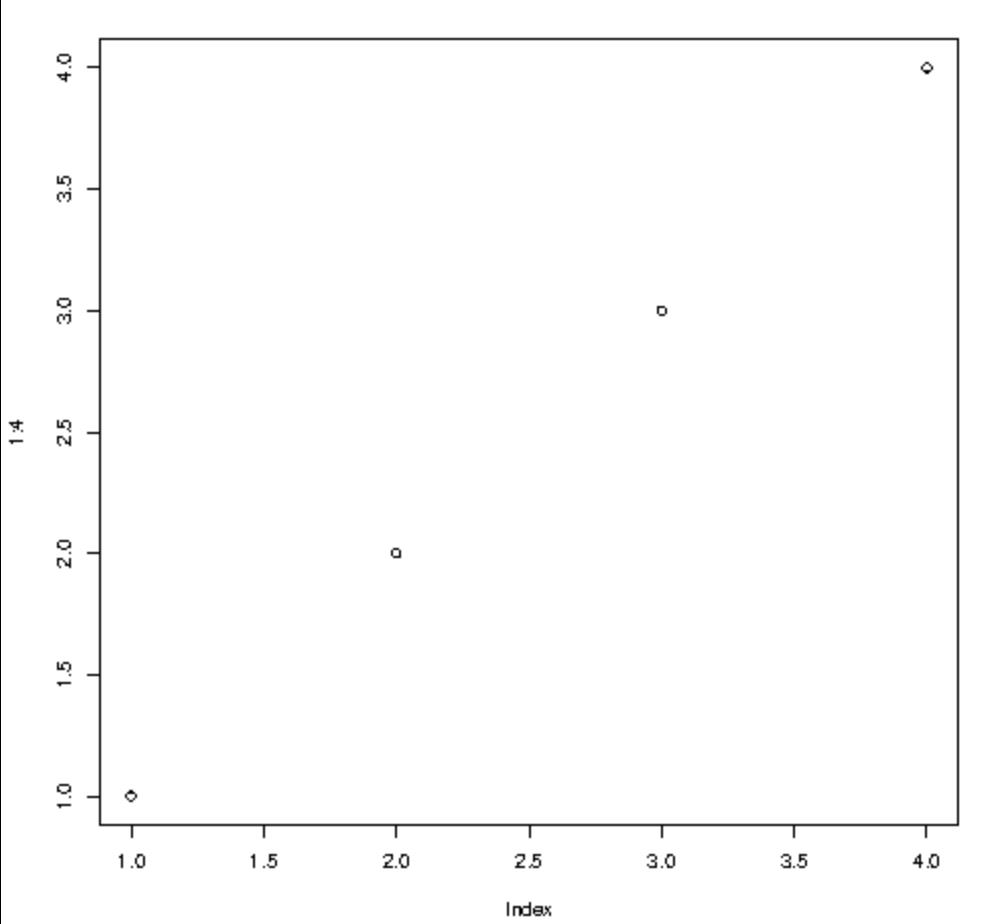
1:4 creates a sequency of four numbers from 1 to 4.
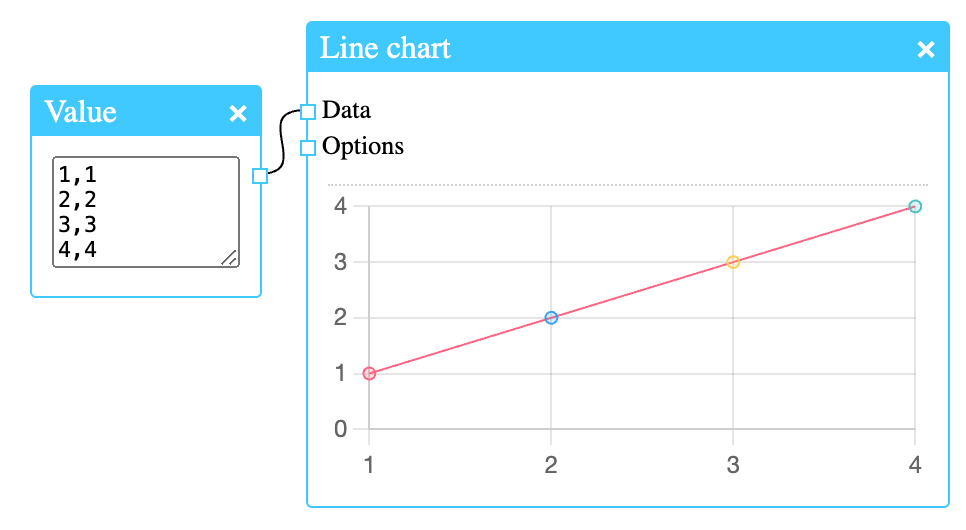
The same can be done in NeoStat, but by default both axes must be specified:
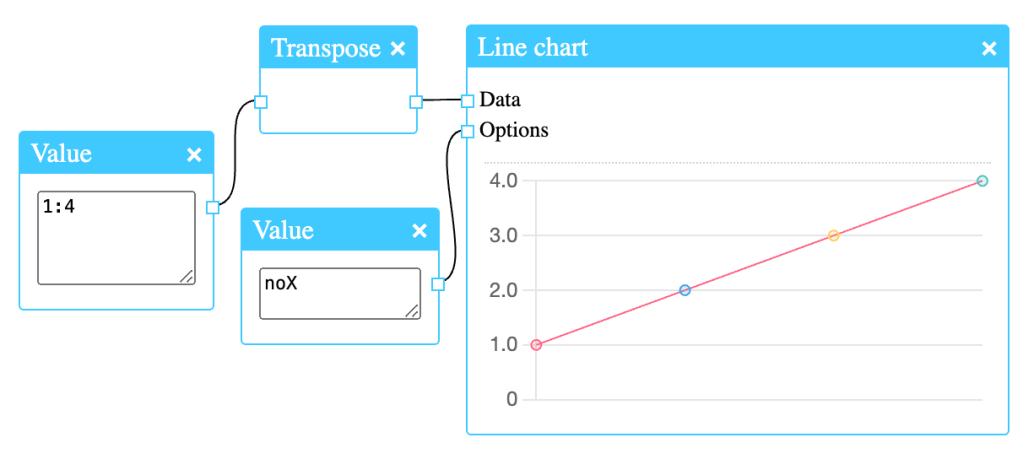
The x coordinates need not be specified if the noX option is passed to the Line chart node. If we wish to use a sequence, a transposition must be done, as the coordinates are expected to be separated by a newline and a sequence is expanded on one line.

Leave a comment