In this post we’ll take a look at how to calculate the volatility of the Microsoft stock (MSFT).
Retrieving prices
First let’s get the historical prices using Alpha Vantage. An API key is free and has to be entered together with the symbol (MSFT) and the time series, which is daily.
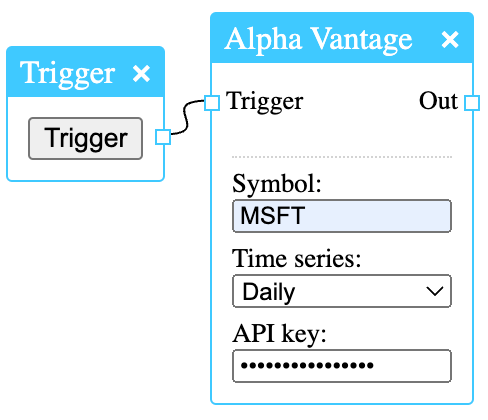
Since the node is making a request to a server, it needs a trigger, so we connect a trigger node. This is the easiest way, but requires user input, which might not be optimal in every context.
Formatting the data
Alpha Vantage gives us a lot of data. We use the Slice node to remove what we don’t need. By adding Inspect nodes we can have a look at the output both before and after slicing.

As you can see, Alpha Vantage gives us the date, volume and open, high, low and closing prices. We only need the closing prices, and we’re happy with the last 40. By entering “*-40:*” we get the last 40 rows. The star “*” is replaced with the total number.
Calculating returns
Calculating logarithmic returns can be done with the Math parser and Lag nodes.
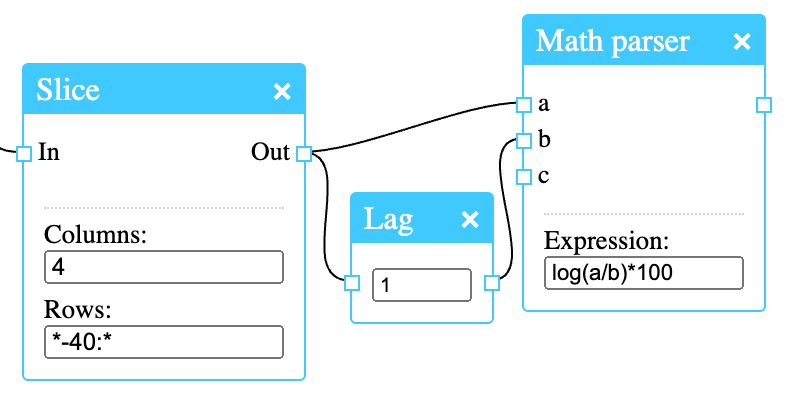
The Lag node shifts the data, so we’re able to compare the price changes between days.
Using standard deviation
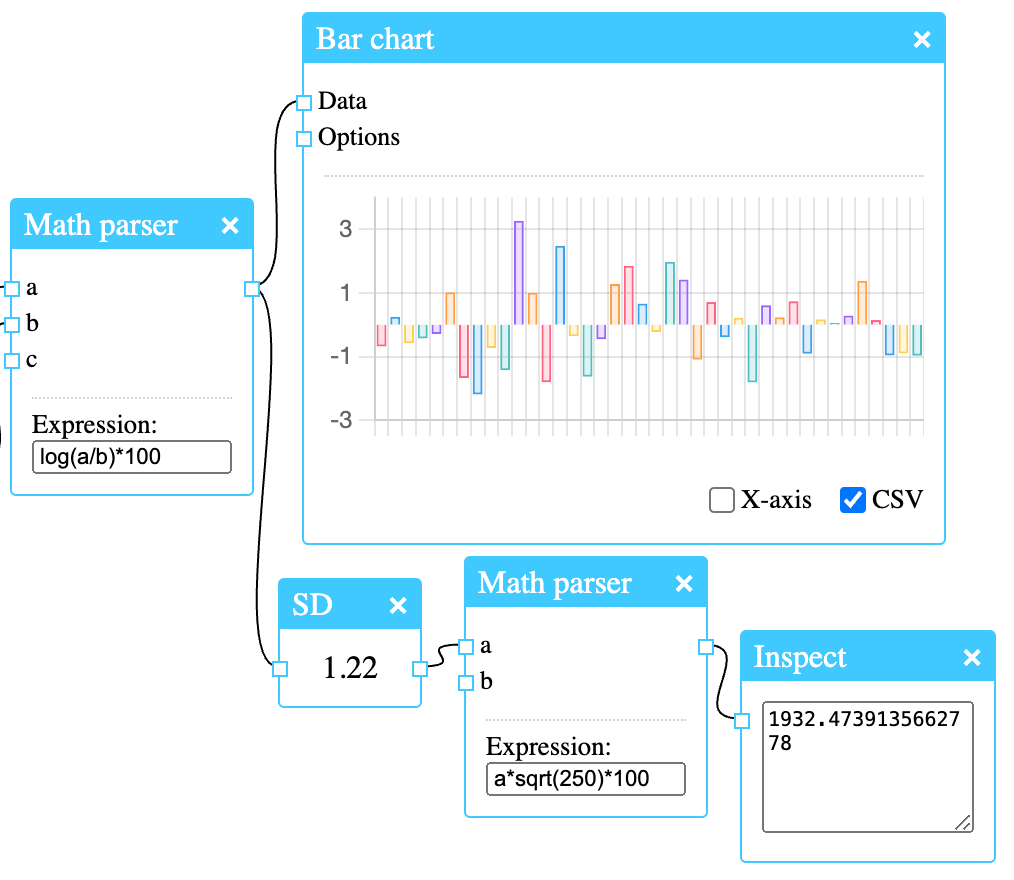
We can graph the price changes by simply connecting the Bar chart node to the output of the Math parser node. It often helps to visualize the data.
We then calculate the standard deviation of the log returns and annualize it by multiplying with the square root of the number of trading days in a year (approximately 250). We can see the result using the Inspect node.
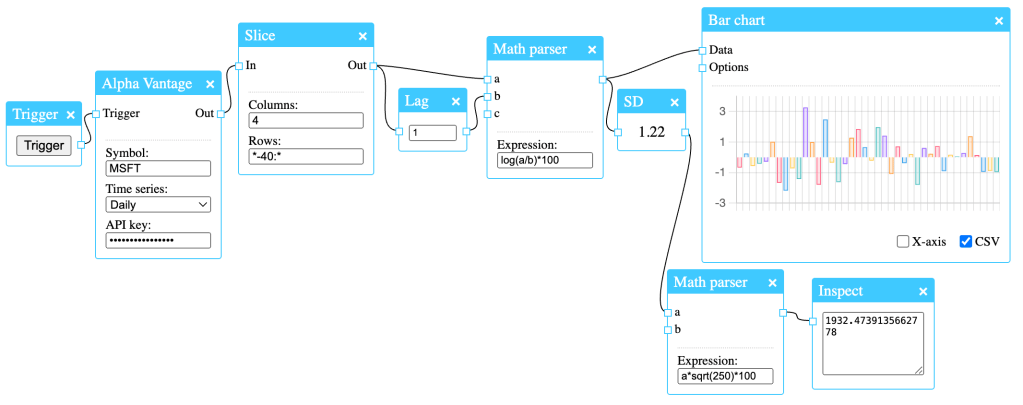
Here is the full diagram:

Leave a comment