-

Introduction In the world of data analysis, missing data is a common challenge. Whether due to non-responses in surveys, data entry errors, or other reasons, missing data can significantly impact the results of statistical analyses. Statistical imputation is a technique used to fill in these missing values with substituted ones, allowing for more complete and…
-
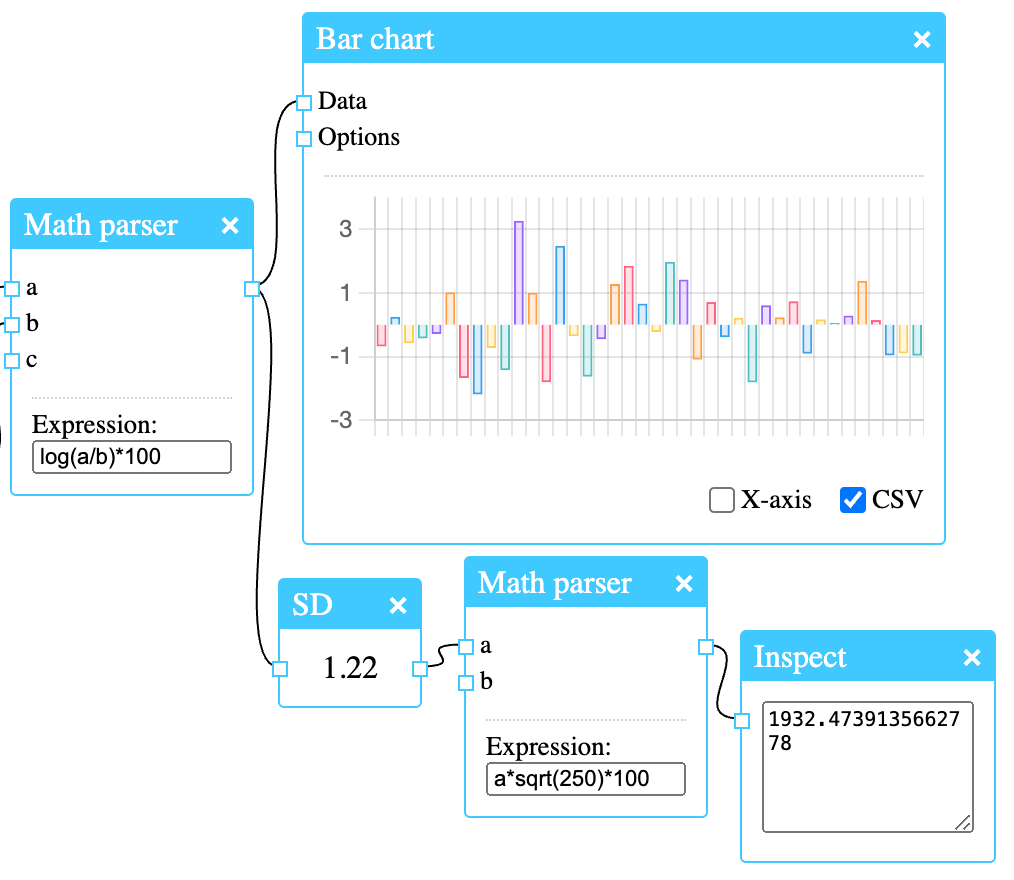
In this post we’ll take a look at how to calculate the volatility of the Microsoft stock (MSFT). Retrieving prices First let’s get the historical prices using Alpha Vantage. An API key is free and has to be entered together with the symbol (MSFT) and the time series, which is daily. Since the node is…
-
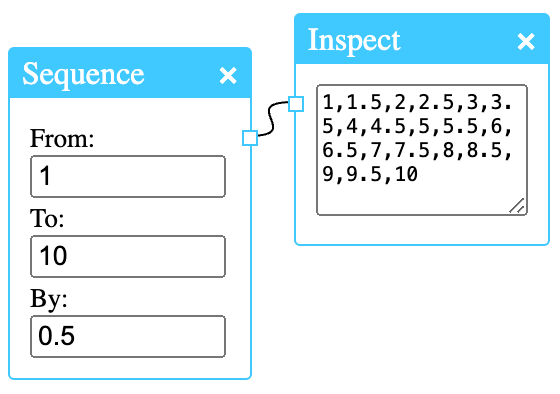
The seq() function generates a sequence. You can control the start and end values, as well as the desired length and step size.
-
Doing simple calculations in R is straight forward. This will print 30: In NeoStat, addition is done with the Add node. In order to see the result, we must connect the output of the Add node to the input of the Inspect node: This is how we plot a vector in R: This will give…
-
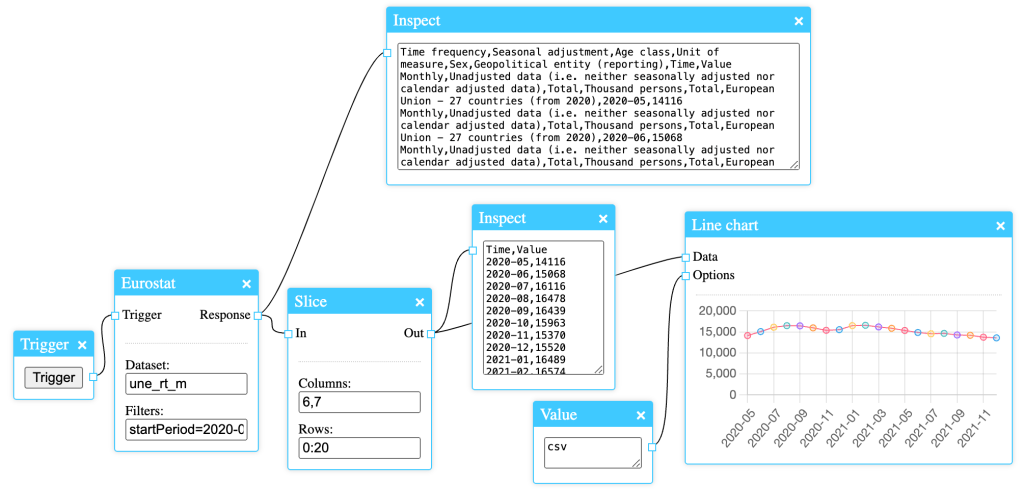
Downloading Eurostat data can be done easily with the Eurostat node. It is a very simple node with only two fields: the dataset name and the filter to be applied to the request. As it accepts all filters that are supported by the Eurostat API, it’s a powerful node, and its results can be further…
-
Sometimes we need to remove parts of a dataset before analysis. The Slice node in NeoStat can be used for this. In this post we’ll be using the famous Iris dataset. The Slice node takes a dataset as input, removes parts of it as specified by two text fields, and then outputs a new dataset.…
-

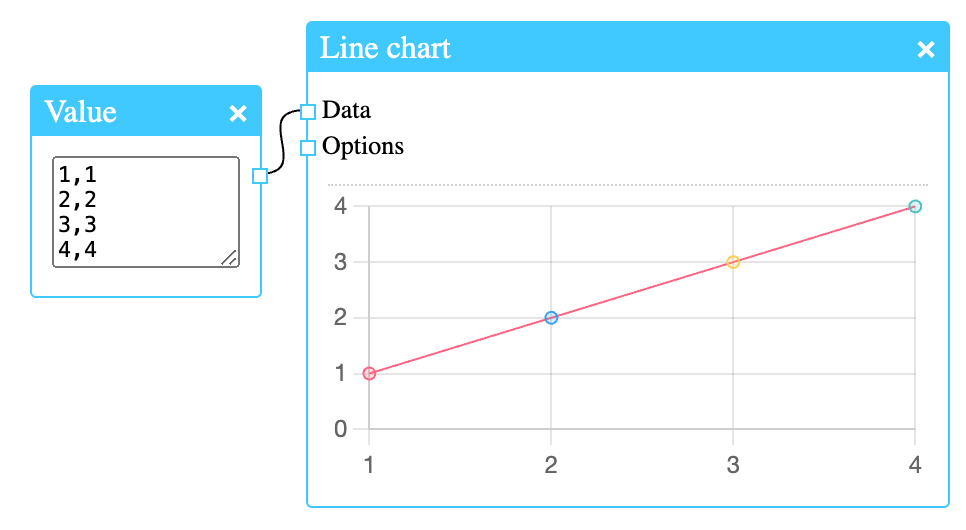
NeoStat has various nodes for the purpose of visualisation. One of them is the Line chart node. The data input can take different formats depending on the options set. Simple coordinates can be given, one on each line. This is the expected format when no options are given. It’s also possible to supply CSV data.…
-
NeoStat is a software for performing statistical computing. It is a viable option for those looking for a more visual workflow when working with data and visualisations. Computation is done by arranging and connecting various nodes in a diagram. It is easy to create a dataset, for instance by using the Value node. The value…
-
Subscribe
Subscribed
Already have a WordPress.com account? Log in now.
