• Performing Basic Calculations and Plotting in R and NeoStat

    Aug 1, 2024
    Uncategorized
    addition, chart, coordinates, graph, line chart, plot, plotting, R alternative, statistics
    Performing Basic Calculations and Plotting in R and NeoStat

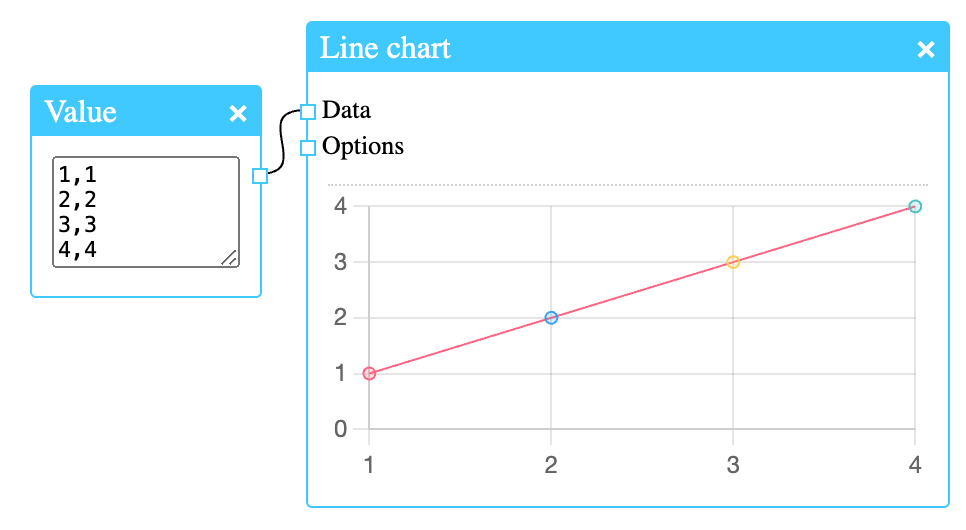
    Doing simple calculations in R is straight forward. This will print 30: In NeoStat, addition is done with the Add node. In order to see the result, we must connect the output of the Add node to the input of the Inspect node: This is how we plot a vector in R: This will give…

  • Easy Eurostat Data Download with the Eurostat Node

    Jul 29, 2024
    Uncategorized
    chart, dataset, download, Eurostat, Eurostat API, node diagram, R alternative, software, software for statistics, statistics
    Easy Eurostat Data Download with the Eurostat Node

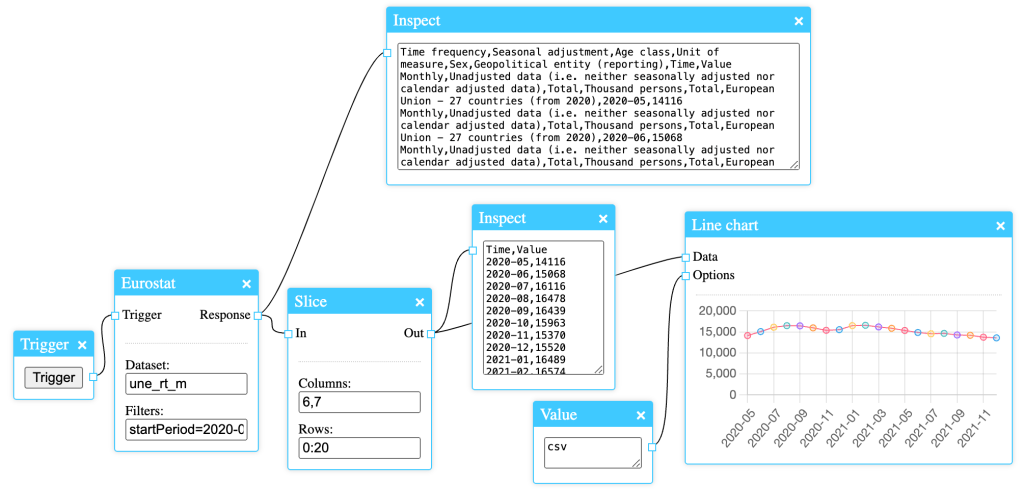
    Downloading Eurostat data can be done easily with the Eurostat node. It is a very simple node with only two fields: the dataset name and the filter to be applied to the request. As it accepts all filters that are supported by the Eurostat API, it’s a powerful node, and its results can be further…

Blog at WordPress.com.

  • Subscribe Subscribed
    • Simple Statistics
    • Already have a WordPress.com account? Log in now.
    • Simple Statistics
    • Subscribe Subscribed
    • Sign up
    • Log in
    • Report this content
    • View site in Reader
    • Manage subscriptions
    • Collapse this bar