• Performing Basic Calculations and Plotting in R and NeoStat

    Aug 1, 2024
    Uncategorized
    addition, chart, coordinates, graph, line chart, plot, plotting, R alternative, statistics
    Performing Basic Calculations and Plotting in R and NeoStat

    Doing simple calculations in R is straight forward. This will print 30: In NeoStat, addition is done with the Add node. In order to see the result, we must connect the output of the Add node to the input of the Inspect node: This is how we plot a vector in R: This will give…

  • Efficient Data Visualization with NeoStat Line and Bar Chart Nodes

    Jul 23, 2024
    Uncategorized
    bar chart, line chart, NeoStat, R alternative, software for statistics, statistics
    Efficient Data Visualization with NeoStat Line and Bar Chart Nodes

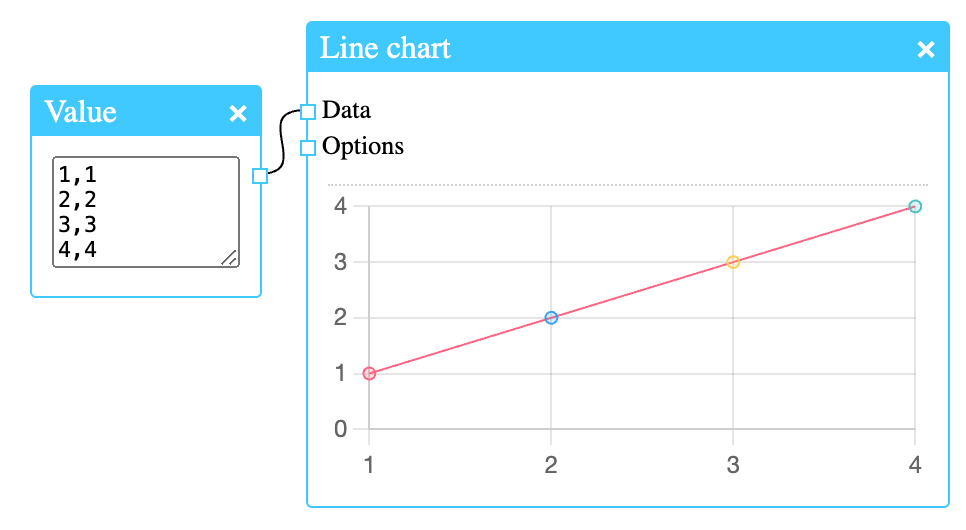
    NeoStat has various nodes for the purpose of visualisation. One of them is the Line chart node. The data input can take different formats depending on the options set. Simple coordinates can be given, one on each line. This is the expected format when no options are given. It’s also possible to supply CSV data.…

Blog at WordPress.com.

  • Subscribe Subscribed
    • Simple Statistics
    • Already have a WordPress.com account? Log in now.
    • Simple Statistics
    • Subscribe Subscribed
    • Sign up
    • Log in
    • Report this content
    • View site in Reader
    • Manage subscriptions
    • Collapse this bar