• Calculating Stock Volatility: Step-by-Step Guide

    Aug 9, 2024
    Uncategorized
    alpha vantage, R alternative, software for statistics, standard deviation, statistics, stock volatility, volatility
    Calculating Stock Volatility: Step-by-Step Guide

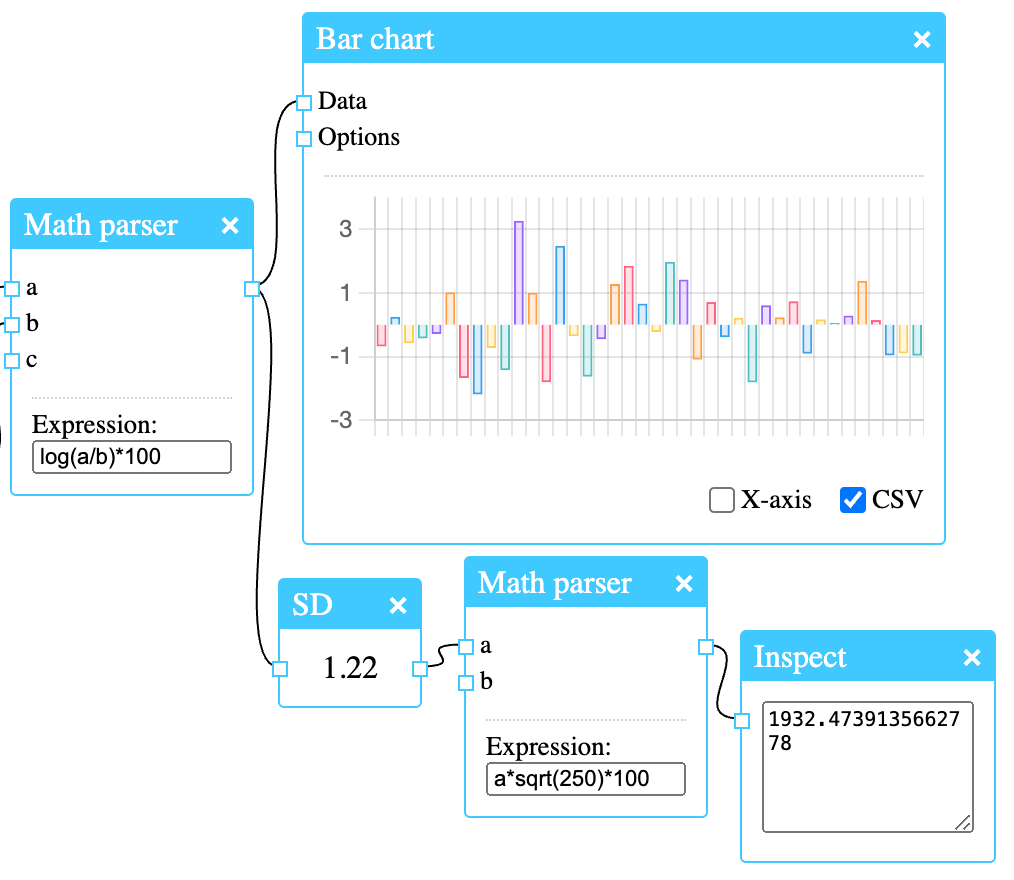
    In this post we’ll take a look at how to calculate the volatility of the Microsoft stock (MSFT). Retrieving prices First let’s get the historical prices using Alpha Vantage. An API key is free and has to be entered together with the symbol (MSFT) and the time series, which is daily. Since the node is…

  • Easy Eurostat Data Download with the Eurostat Node

    Jul 29, 2024
    Uncategorized
    chart, dataset, download, Eurostat, Eurostat API, node diagram, R alternative, software, software for statistics, statistics
    Easy Eurostat Data Download with the Eurostat Node

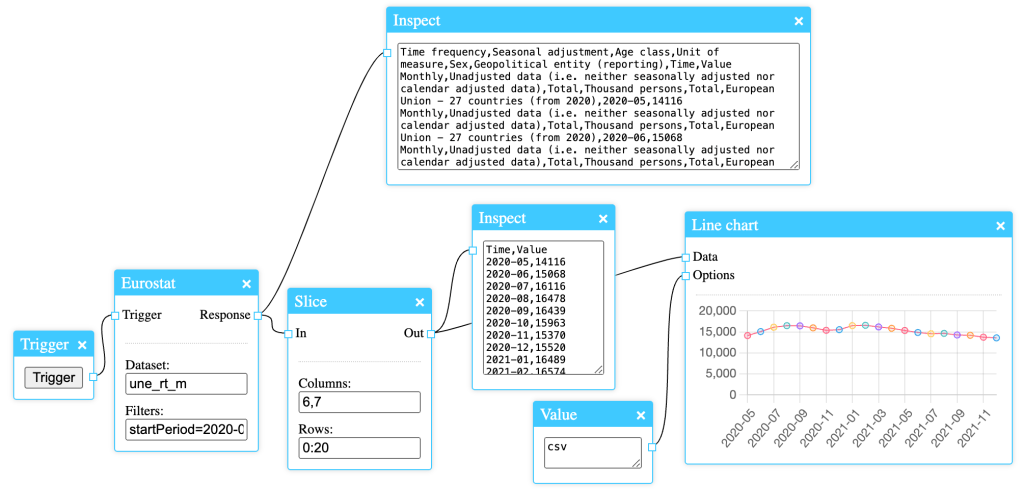
    Downloading Eurostat data can be done easily with the Eurostat node. It is a very simple node with only two fields: the dataset name and the filter to be applied to the request. As it accepts all filters that are supported by the Eurostat API, it’s a powerful node, and its results can be further…

  • Efficient Data Visualization with NeoStat Line and Bar Chart Nodes

    Jul 23, 2024
    Uncategorized
    bar chart, line chart, NeoStat, R alternative, software for statistics, statistics
    Efficient Data Visualization with NeoStat Line and Bar Chart Nodes

    NeoStat has various nodes for the purpose of visualisation. One of them is the Line chart node. The data input can take different formats depending on the options set. Simple coordinates can be given, one on each line. This is the expected format when no options are given. It’s also possible to supply CSV data.…

Blog at WordPress.com.

  • Subscribe Subscribed
    • Simple Statistics
    • Already have a WordPress.com account? Log in now.
    • Simple Statistics
    • Subscribe Subscribed
    • Sign up
    • Log in
    • Report this content
    • View site in Reader
    • Manage subscriptions
    • Collapse this bar